Deployment
KWDB uses Prometheus to collect and store monitoring and performance metrics for your cluster and uses Grafana to visualize these data in the dashboards. This document describes how to deploy Prometheus and Grafana.
Deploy Prometheus
Download the latest Prometheus for your platform and then extract it to a local directory.
This example extracts Prometheus v2.53.0.
tar -zxvf prometheus-2.53.0.linux-amd64.tar.gzCreate a folder named
rulesunder theprometheus-2.53.0.linux-amd64directory.Download configuration files of the Prometheus alerting rules and aggregation rules and store them to the
rulesfolder.KWDB provides the
alerts.rules.ymlandaggregation.rules.ymlconfiguration files under themonitoring/rulesdirectory. For detailed configurations about alerting rules and aggregation rules, see Prometheus Alerting Rules and Prometheus Aggregation Rules.alerts.rules.yml: The configuration file of the Prometheus alerting rules.aggregation.rules.yml: The configuration file of the Prometheus aggregation rules.
Configure Prometheus.
cd prometheus-2.53.0.linux-amd64 &&
vi prometheus.yml
Here is an example configuration file. You can change the parameters and their values as required.
# Prometheus configuration for KWDB clusters.
# Requires prometheus 2.X
#
# Run with:
# $ prometheus -config.file=prometheus.yml
global:
  scrape_interval: 10s
  evaluation_interval: 10s

rule_files:
- "rules/alerts.rules.yml"
- "rules/aggregation.rules.yml"

scrape_configs:
  - job_name: 'kwdb'
    metrics_path: '/_status/vars'
    # Insecure mode:
    scheme: 'http'
    # Secure mode:
    # scheme: 'https'
    tls_config:
      insecure_skip_verify: true

    static_configs:
    - targets: ['localhost:8080', 'localhost:8081', 'localhost:8082']
      labels:
        cluster: 'my-kwdb-cluster'
Parameters:
global: Global configurations about the Prometheus Server.scrape_interval: Sepcify how frequently the Prometheus Server scrapes data.evaluation_interval: Sepcify how frequently the Prometheus Server evaluates rules. Prometheus uses rules to create new time series and generate alarms.
rule_files: Specify the path to the rule files loaded by the Prometheus Server.scrape_configs: Specify a set of targets and parameters describing how to scrape them. In general, one scrape configuration specifies a single job. Targets may be statically configured via thestatic_configsparameter or dynamically discovered using one of the supported service-discovery mechanisms.job_name: Specify the job name assigned to scraped metrics.metrics_path: Specify the HTTP resource path on which to fetch metrics from targets.scheme: Configure the protocol scheme used for requests.tls_config: Configure the request's TLS settings.static_configs: Specify a list of labeled statically configured targets for this job.
For details about all Prometheus configurations, see Prometheus Documentation.
Start Prometheus.
./prometheus --config.file=prometheus.ymlBy default, Prometheus is started on port
9090. You can use the--web.listen-addressparameter to change the listening port as required. This example changes the listening port ID to8091../prometheus --config.file=prometheus.yml --web.listen-address=:8091To view all CLI parameters supported by Prometheus, run the
./prometheus -hcommand.Log in to Prometheus.
By default, you can access Prometheus through
http://localhost:9090after starting Prometheus.
Deploy Grafana
Download the latest Grafana for your platform and then extract it to a local directory.
This example downloads Grafana v11.1.0.
wget https://dl.grafana.com/enterprise/release/grafana-enterprise-11.1.0.linux-amd64.tar.gz
tar -zxvf grafana-enterprise-11.1.0.linux-amd64.tar.gz
Start Grafana.
cd grafana-v11.1.0/bin
./grafana-server
Configure Grafana
Add Prometheus Data Source
Log in to Grafana.
By default, you can access Grafana through
http://localhost:3000using the default username and password (Both areadmin).From the left-side menu, click Connections > Data sources.
At the Data sources window, click Add data source, and then select Prometheus.
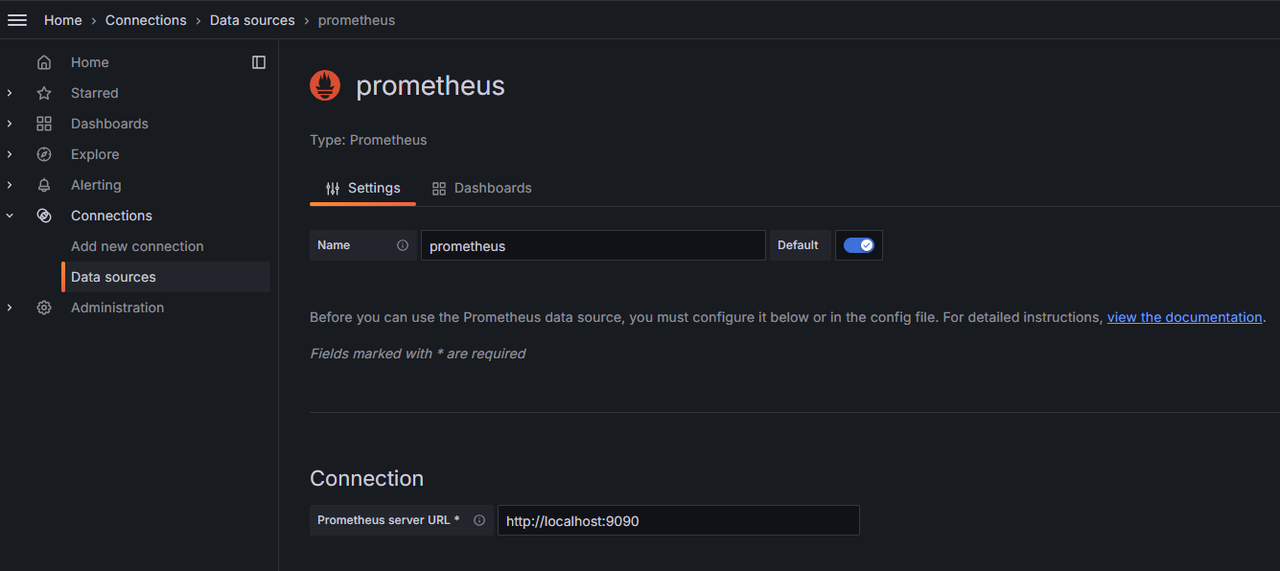
Configure the Prometheus.
Name: The name of the Prometheue data source.Prometheus server URL: The IP address of the Prometheus Server.- Configure other options as required.
Click Save & test.
Import Grafana Dashboards
By default, KWDB provides the following metric dashboards under the monitoring/grafana-dashboards directory. After importing these metric dashboards into Grafana, you can monitor the KWDB cluster.
- Overview: Show critial metrics for your cluster or for the specific node.
- Hardware: Show hardware-related metrics.
- Runtime: Show runtime-related metrics.
- SQL: Show SQL-related metrics.
- Storage: Show storage-related metrics.
- Replication: Show replication-related metrics.
- Distribution: Show distribution-related metrics.
- Queue: Show queue-related metrics.
- Slow query: Show metrics about slow queries.
To import KWDB metric databoards, follow these steps.
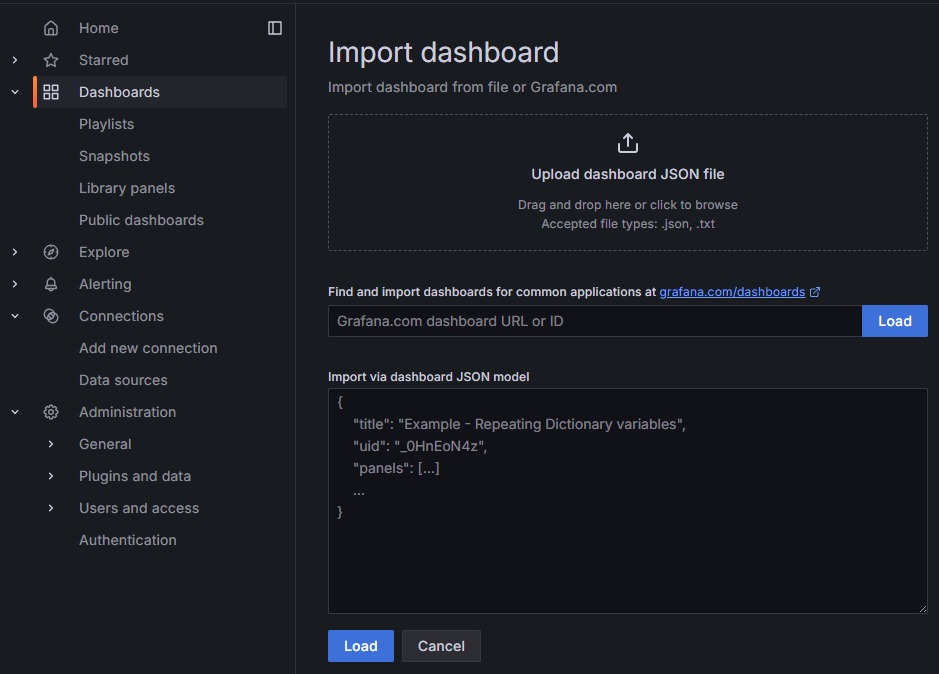
From the left-side menu, click Dashboards.
At the Dashboard window, click New and then select Import from the drop-down list.
Select the target metric dashboards and then click Load.
Note
By default, KWDB provides the following metric dashboards under the
monitoring/grafana-dashboardsdirectory. Here lists the file names of these metric dashboards.- Overview:
1.KaiwuDB_Console_Overview.json - Hardware:
2.KaiwuDB_Console_Hardware.json - Runtime:
3.KaiwuDB_Console_Runtime.json - SQL:
4.KaiwuDB_Console_SQL.json - Storage:
5.KaiwuDB_Console_Storage.json - Replication:
6.KaiwuDB_Console_Replication.json - Distribution:
7.KaiwuDB_Console_Distribution.json - Queue:
8.KaiwuDB_Console_Queue.json - Slow query:
9.KaiwuDB_Console_Slow_Query.json
- Overview:
(Optional) From the left-side menu, click Dashboards and then select any metric dashboard to view related metrics.